a weekend walk around the Bokeh library
If you’ve read my bio, you will know that I (somewhat arrogantly) consider myself “a passionate advocate for the use of programming by life scientists”. This came about following my Cambridge trip during my doctoral degree, in which I began to code analysis programs to derive meaning from the large (tens of gigabyte) datasets that we were collecting on a daily basis. At the time, I first learnt IgorPro - a proprietary language used by the other members of my host lab. While it was a steep learning curve, I was hooked. The power of being able to analyse huge reams of data without a single copy-paste-formula manouver normally completed in spreadsheets? Sign me up! Take out the human error of transferring data from program to program (Excel, GraphPad…) to achieve a result? Tell me more!
After my initial introduction, I quickly went in search of a more versatile language to learn. I disliked the feeling of being locked into the facilities provided within the commercial platform, and was tired of not being able to easily find support for this program online. And so, I met Python. And boy, did we hit it off! Python is easily the most friendly programming language I have come across, it is versatile and open source, the community is amazingly friendly, and I am yet to come across a problem I can’t solve via a quick trip to StackOverflow (seriously, where would I be without you guys?).
Little by little, I have worked on building my skills and I learn a little more each day. For a while now I have been comfortable writing small scripts that assist in my data analysis and plotting needs. However, I was yet to venture into the world of interactive plotting. I have always been intrigued by all of the different ways we can visualise data, and believe interactive plotting is a great way to allow both myself and someone else to explore a dataset. With this in mind, I set out this weekend to explore an interactive plotting library in python - Bokeh.
“Bokeh is an interactive visualization library that targets modern web browsers for presentation… Bokeh can help anyone who would like to quickly and easily create interactive plots, dashboards, and data applications.”
Sounds pretty good right? So, I gave it a go. As a test dataset, I decided to recreate the scatter plot from a recent article published by our group for which the supplementary data is readily available. This plot displays the proteins whose cysteine residues significantly changed their reactivity following treatment with the drug Tunicamycin (an inducer of endoplasmic reticulum stress). Below you can find my version of Figure 6b, constructed as it is displayed in the article using Excel and GraphPad.
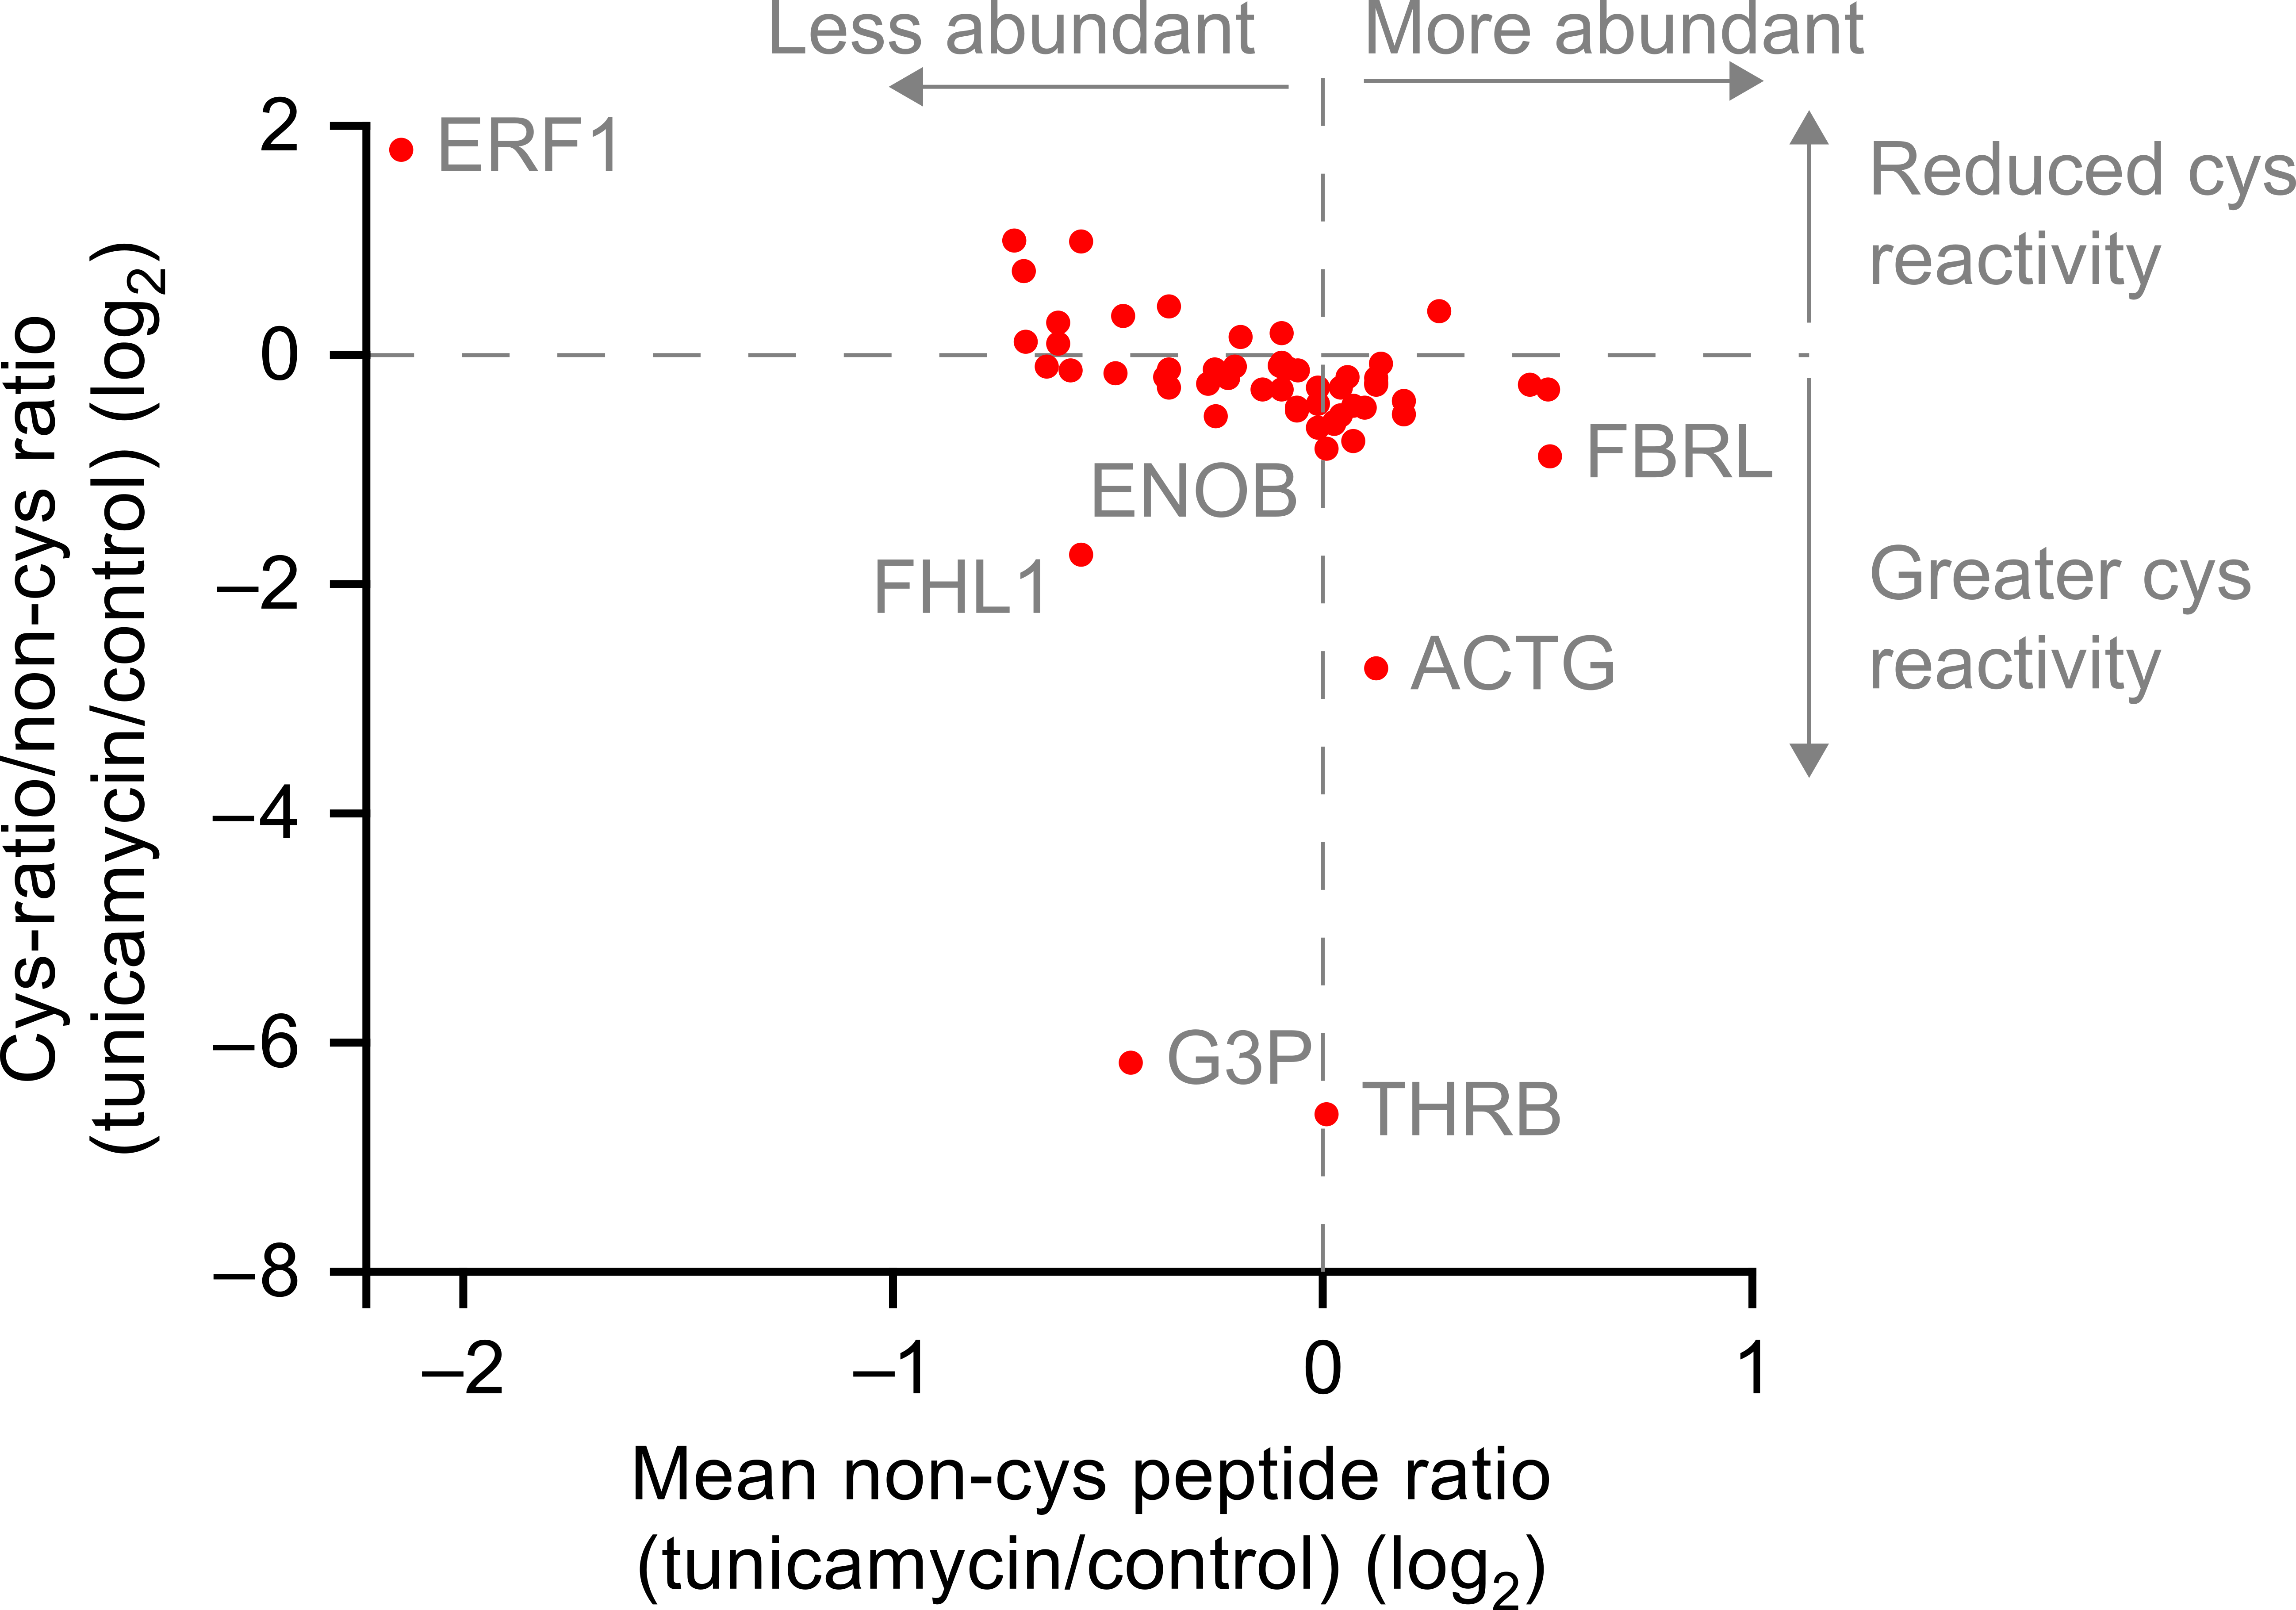
To recreate this plot in python, I took the raw data and constructed the scatter plot, colouring each datapoint according to the level of significance (as determined by the p-value). I also mapped the gene names associated with each datapoint via the UniProt API (a second learning exercise for this weekend!). This provides a second layer of data which I used to create the interactive feature of the graph - instead of displaying static names for only a few of the genes (which is limited by the need to not overcrowd the plotting area), gene names and ontology information is displayed by hovering over the point of interest. My final product is below - go ahead, give it a try! I found it super simple to embed the output here, plus there is also some handy toolbars provided by Bokeh out of the box that allow the plot to be saved to png or svg from the current view.
Bokeh Plot
I must say, I have been thoroughly impressed so far. Bokeh makes it extremely easy to build simple plots from existing pandas dataframes (think: spreadsheets) and to overlay interactivity without too much extra hassle. It offers the ability to completely customise the plots and layouts with widgets and extra functionality, although I think even the standard plotting elements I used here look pretty stunning in comparison to the original version!
So, here it is - my first passionate post about the benefits of programming for life scientists. Even if you take away the amazing benefits of reproducibilty, shareability, scalability and efficiency - the sheer ability to easily produce stunning visualisations that can be shared is a great asset. If you haven’t jumped on the programming bandwagon yet, what are you waiting for??